· Jakub · Platform Engineering · 8 min read
Production SigNoz on EKS: Cost-Optimized Observability with Tiered Storage and Auto-Instrumented APM
How I designed a production observability platform using SigNoz on EKS with S3-tiered cold storage, KEDA-scaled OpenTelemetry collectors, zero-code Python APM via the OTel Operator, and encrypted RDS metadata — optimized for cost without sacrificing retention or trace depth.
Introduction
The client — a SaaS company running multiple workloads on EKS — needed a self-hosted observability platform that could ingest metrics, traces, and logs from across their infrastructure without the per-seat or per-GB pricing of commercial vendors. They had outgrown basic CloudWatch dashboards and needed correlated telemetry with long-term retention.
I designed and delivered a production SigNoz deployment on their existing EKS cluster. The core challenge was balancing retention depth (months of telemetry data) against storage cost, while ensuring the ingestion pipeline could scale with bursty workloads — all without dedicated infrastructure team overhead.
System Architecture
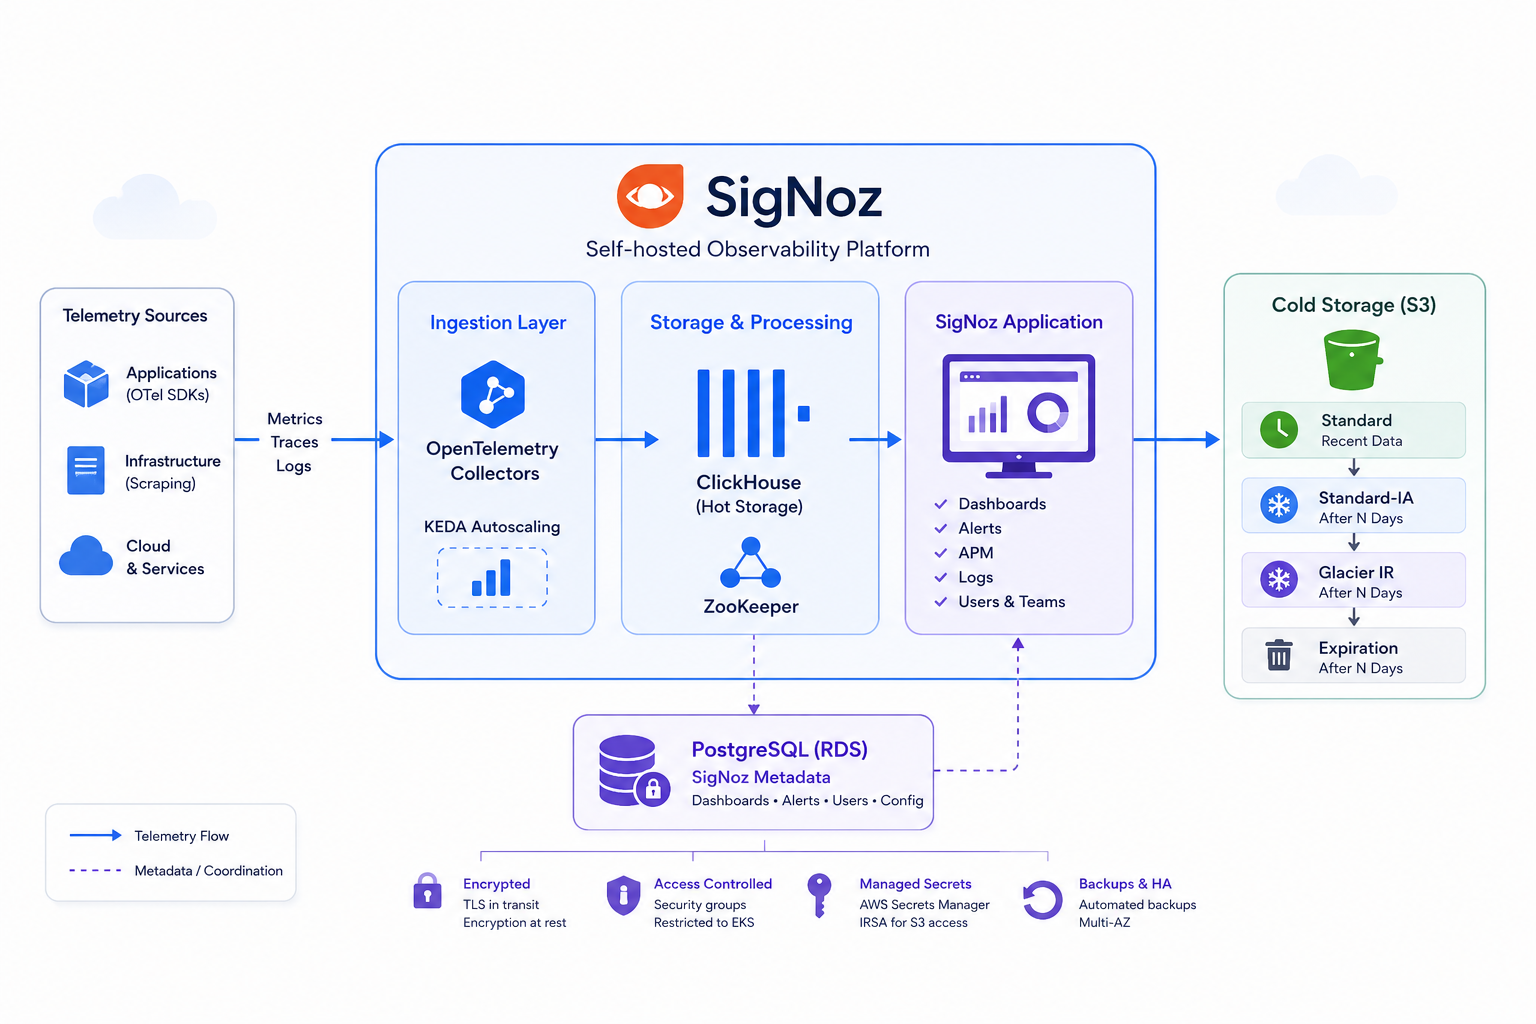
The system consists of five primary layers:
Application Instrumentation — Zero-code OpenTelemetry auto-instrumentation injected into Python application pods via the OpenTelemetry Operator, emitting traces, spans, and runtime metrics without code changes.
Ingestion — OpenTelemetry Collectors running as scalable deployments, receiving telemetry from auto-instrumented application pods and scraping infrastructure targets (Karpenter, KEDA, ArgoCD, LiteLLM, Valkey).
Processing — ClickHouse as the primary TSDB for hot telemetry data, backed by Zookeeper for coordination.
Cold Storage — S3 with a multi-tier lifecycle policy that moves aging data from Standard → Standard-IA → Glacier IR → expiration.
Metadata — An encrypted PostgreSQL RDS instance storing SigNoz application state (dashboards, alerts, users), decoupled from ClickHouse.
The entire stack is defined in Terraform (infrastructure) and Helm (workloads), deployed via ArgoCD.
Application-Level Telemetry: Zero-Code APM
One of the most impactful decisions was leveraging the OpenTelemetry Operator for automatic instrumentation. Rather than requiring developers to add SDK calls throughout the codebase, I deployed the Operator with an Instrumentation custom resource that injects the Python auto-instrumentation agent at pod startup.
apiVersion: opentelemetry.io/v1alpha1
kind: Instrumentation
metadata:
  name: backend-otl
spec:
  exporter:
    endpoint: "http://signoz-otel-collector.signoz.svc:4317"
  propagators:
    - tracecontext
    - baggage
  sampler:
    type: parentbased_traceidratio
    argument: "1"
  python:
    image: ghcr.io/open-telemetry/opentelemetry-operator/autoinstrumentation-python:latest
Application pods opt in via a single annotation:
podAnnotations:
  instrumentation.opentelemetry.io/inject-python: "backend-otl"
env:
  - name: OTEL_SERVICE_NAME
    value: "backend"
  - name: OTEL_RESOURCE_ATTRIBUTES
    value: "service.namespace=backend,deployment.environment=prod"
This gives us full distributed tracing across the entire application stack — API handlers (Django/Gunicorn), Celery workers, Celery Beat schedulers, and Flower monitoring — without a single line of instrumentation code. Each component reports with a distinct OTEL_SERVICE_NAME, making service maps and dependency graphs immediately useful in SigNoz.
The OpenTelemetry Operator runs with two replicas and topology spread constraints across nodes, ensuring the webhook that mutates pods for injection remains available during node rotations.
What APM Data Flows
With the Python auto-instrumentation agent injected, the following telemetry is captured automatically:
- Distributed traces — full request lifecycle across HTTP handlers, database queries (Django ORM → PostgreSQL), cache operations (Valkey/Redis), and inter-service calls
- Span attributes — HTTP method, status code, URL path, database statement, queue name for Celery tasks
- Runtime metrics — Python GC stats, thread counts, process memory
- Celery task traces — each background job becomes a span with task name, queue, execution duration, and retry metadata
- Exception tracking — unhandled exceptions are captured as span events with full stack traces
Because every service — API, backend, worker, beat, flower — reports to the same collector endpoint, SigNoz can reconstruct end-to-end traces that span an HTTP request hitting the API, dispatching a Celery task, the worker processing it, and any downstream calls. This is the kind of visibility that typically requires commercial APM tools costing $50k+/year at this scale.
The sampler is configured as parentbased_traceidratio, meaning the sampling decision propagates from the entry point. This ensures complete traces — you never get orphaned child spans from a partially-sampled request flow.
Runtime & Scaling Behavior
The OpenTelemetry Collectors are the most dynamic component. They use KEDA for horizontal autoscaling — scaling based on actual ingestion pressure rather than static CPU thresholds. This is critical because telemetry volume correlates with application traffic, not collector resource consumption.
otelCollector:
  keda:
    enabled: true
  config:
    processors:
      memory_limiter:
        limit_mib: 1000
        check_interval: 5s
      batch:
        timeout: 10s
        send_batch_size: 1000
The memory limiter acts as a backpressure mechanism — if a collector pod approaches 1 GiB, it starts dropping data rather than OOMing. The batch processor aggregates telemetry into 1000-item batches with a 10-second flush window, reducing write amplification on ClickHouse.
Collectors run on Spot instances with appropriate tolerations and weighted affinity. This cuts compute cost for a workload that is inherently stateless and tolerant of interruption.
The collectors also handle a dedicated infrastructure metrics pipeline — scraping Prometheus endpoints from Karpenter, KEDA, ArgoCD (server, repo-server, and application-controller), LiteLLM, and a Redis/Valkey exporter. These flow through a separate metrics/infra pipeline with the same memory limiter and batch processors, keeping infrastructure metrics isolated from application trace ingestion.
Tiered Storage Lifecycle
ClickHouse’s cold storage is configured to offload older partitions to S3:
resource "aws_s3_bucket_lifecycle_configuration" "signoz_lifecycle" {
  rule {
    id     = "expire-old-telemetry"
    status = "Enabled"
    filter {}

    transition {
      days          = var.signoz_retention_standard_ia_days
      storage_class = "STANDARD_IA"
    }
    transition {
      days          = var.signoz_retention_glacier_days
      storage_class = "GLACIER_IR"
    }
    expiration {
      days = var.signoz_retention_expire_days
    }
  }
}
This creates a three-stage cost curve. Recent data stays on gp3 EBS in ClickHouse for fast queries. After a configured threshold, it transitions to S3 Standard-IA (roughly 45% cheaper per GB), then Glacier Instant Retrieval (68% cheaper), before final expiration. The bucket has versioning disabled intentionally — telemetry is append-only and reproducible from source systems. Server-side encryption (AES256) is enforced, and all public access is blocked.
PostgreSQL Metadata Store
Rather than running PostgreSQL inside the cluster, I deployed a dedicated RDS instance for SigNoz’s application metadata:
resource "aws_db_instance" "signoz" {
  engine                = "postgres"
  instance_class        = var.instance_class
  storage_type          = "gp3"
  storage_encrypted     = true
  multi_az              = var.multi_az
  deletion_protection   = true
  monitoring_interval   = 1
  performance_insights_enabled = true
}
Credentials are sourced from Secrets Manager and injected into the SigNoz pods via Kubernetes secrets. The RDS instance enforces SSL via a parameter group (rds.force_ssl = 1), and the security group restricts access exclusively to the EKS node security groups and specific internal CIDRs.
This separation means ClickHouse failures don’t corrupt dashboard state, and the metadata store can be independently backed up, scaled, or restored.
Key Engineering Decisions
OTel Operator over SDK instrumentation. Manual SDK integration across a multi-service Python stack (API, workers, beat, flower) would require coordinated developer effort and ongoing maintenance. The Operator’s injection approach means any new service gets full APM coverage by adding a single annotation — the platform team controls instrumentation centrally.
KEDA over HPA for collectors. HPA scales on CPU/memory — poor proxies for telemetry throughput. KEDA allows scaling on queue depth or custom metrics, matching actual ingestion load.
Internal ALB with shared group. The SigNoz frontend is exposed via an internal ALB using AWS Load Balancer Controller’s group feature. This avoids provisioning a dedicated load balancer (saving ~$16/month base cost) while maintaining SSL termination and path-based routing.
IRSA for S3 cold storage access. ClickHouse pods assume an IAM role via EKS service account annotation, eliminating long-lived credentials for bucket access.
Decoupled RDS from ClickHouse. SigNoz supports SQLite by default. Externalizing to RDS adds operational cost but provides durability guarantees, automated backups, and independent scaling that a production deployment requires.
Separate OTEL_SERVICE_NAME per component. Each deployment (api, backend, worker, beat, flower) reports a distinct service name with shared namespace attributes. This makes SigNoz’s service map and dependency graphs immediately actionable — you can see which Celery queue is slow without digging through a single monolithic service.
Trade-offs
Optimized for: long-term retention cost, ingestion elasticity, operational durability, security posture, developer velocity (zero-code instrumentation).
Sacrificed: query latency on cold data (Glacier IR adds milliseconds, not seconds — acceptable for historical investigations), slight operational complexity from managing RDS separately, and the precision of manual SDK instrumentation (auto-instrumentation captures fewer custom business attributes than hand-written spans).
The Spot instance strategy for collectors also means occasional pod rescheduling. This is acceptable because collectors are stateless and the batch processor ensures minimal data loss during graceful termination. However, it does create brief gaps in scrape-based metrics during node reclamation.
The auto-instrumentation agent adds marginal memory overhead (~50-80 MiB per pod) and negligible latency to requests. For the client’s workload profile — Django API serving tenant requests and Celery processing background jobs — this overhead is invisible compared to actual business logic execution time.
Cost & Operational Impact
The tiered storage approach means telemetry retention cost decreases non-linearly with age. A system ingesting 50 GB/day pays full gp3 rates only for the hot window. After lifecycle transitions, the effective per-GB cost drops to roughly one-third of the initial rate.
Running collectors on Spot provides 60–70% savings on that compute tier. The RDS instance (smallest viable class with gp3 storage) adds a fixed monthly cost but eliminates the risk of metadata loss that would require full platform reconfiguration.
The zero-code APM approach eliminates what would otherwise be weeks of developer time instrumenting each service. More importantly, it ensures consistent telemetry quality — every service gets the same trace propagation, the same sampling strategy, and the same attribute enrichment, regardless of which team owns it.
Conclusion
This architecture gives the client vendor-independent observability with months of queryable retention and full distributed tracing across their Python stack — at a fraction of commercial APM pricing. The key insight: combining the OpenTelemetry Operator’s zero-code injection with KEDA-scaled collectors and tiered S3 storage creates an observability platform that scales with the application automatically, while cost scales sub-linearly with data volume.
If you’re working on similar observability or APM infrastructure challenges, you can contact me at hello@jakops.cloud.